
There is the numbers, and there is the reality — Brian Kilmeade of Fox “News”
You’ve no doubt heard the bromide, generally attributed to Benjamin Disraeli but popularized by Mark Twain, that “There are three kinds of lies: lies, damned lies, and statistics.” And yet you also probably have heard it said, or at least strongly suggested — as the present site itself has done at times — that statistics don’t lie. So which is more accurate? Surely you must realize that cold hard numbers are more reliable than narratives, spin, theories, guesses, soundbites and tropes. But do statistics indeed lie at times? And if so, how commonly?
Well, you may rest easy. With apologies to Disraeli and Twain, the correct choice is B. Statistics rarely if ever “lie” as such. But — and it’s a big but — this is presuming that they are calculated and applied properly. If not, then certainly there is ample room for abuse. It isn’t that statistics themselves lie; it’s just that liars and manipulators can use, or rather misuse, statistics to deceive. Let’s look at some ways in which this can, and does, happen.
1. Insufficient sampling
This is one case in which it might be said that statistics do indeed “lie”, in the sense that the data collected point to a misleading conclusion. It’s important that the sample size be sufficiently large, or else the conclusions will be not only meaningless, but quite possibly drastically wrong.
If you see a roulette wheel that has spun black ten times in a row, you might be tempted to conclude that this wheel will always spin black, and wager a fortune on the next spin or two. If so, you and your money will be parted soon enough.
One real-world example of insufficient sampling we’ve reported about is the claim that the law in Kennesaw, Georgia requiring all residents to own a gun is responsible for a drop in crime. Among other problems with such a claim, the crime numbers are far too low to constitute, or measure, a meaningful correlation. (More about that later.)
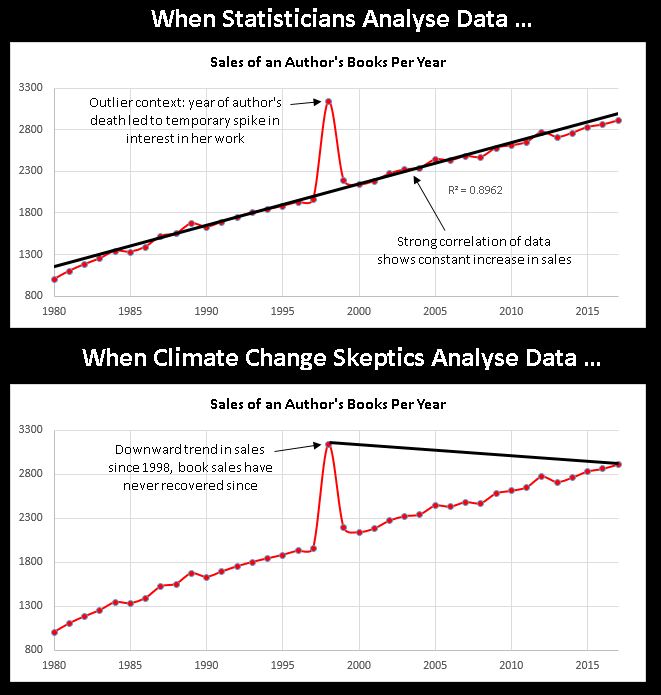
2. Truncated Sample
In some data sets, there is a sufficient sample size, but whoever presents the figures only offers a limited range, whether deliberately or not. This is known as cherry picking. The following graphic is an excellent illustration.
3. Flawed Collection Procedure
Many statistics (or numbers claiming to be statistics) come from studies and surveys. And there are several different ways in which studies and surveys can be skewed. Sometimes, for example, you’ll hear results of polls in which the respondents are self-selected rather than randomly chosen. Any poll that people respond to online should be taken with an ocean full of salt. And you can’t necessarily expect stats compiled exclusively about urban dwellers — or rural dwellers — to form an accurate profile of an entire nation.
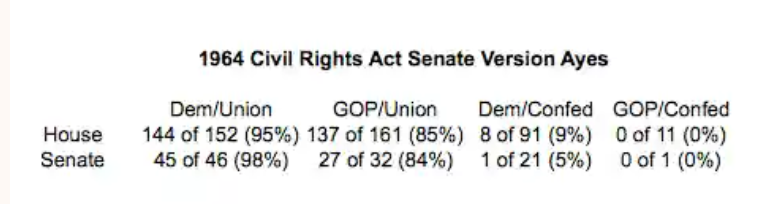
Sometimes, despite the most earnest efforts of statisticians and researchers, certain information gets omitted, thereby warping the results. The claim that a larger percentage of Republicans than Democrats supported the Civil Rights Act of 1964 is true as far as it goes. But it fails to consider that (a) there were considerably more Democrats than Republicans in both houses, and (b) a considerably larger percentage of the Democrats at that time were Southern; so (c) when you break it down by North and South, the Democrats voted for the bill by a larger percentage across the board. (No, this isn’t tweaking or spinning the numbers. It’s examining a more significant factor at the time than party — i.e., geography.)
And sometimes you have the opposite problem: not narrowing the sample space enough. A case in point is a study or two indicating that moderate alcohol consumption contributes to longevity. The error the researchers committed here was including among the non-drinkers those individuals who previously had been heavy imbibers, but became teetotalers because the booze already had savaged their health. When such respondents were filtered out, the “benefits” of alcohol evaporated like a campaign promise after election day.
And of course, as pretty much everybody is aware, some “studies” are either conducted sloppily — and not peer-reviewed — or deliberately gamed to produce a desired result. Years ago, there were TV commercials touting something like “four out of five doctors surveyed preferred our cigarettes to Brand X” (yes, kiddies, tobacco companies once advertised on TV) without mentioning that those doctors were methodically chosen to prefer the said brand — or that many doctors thought both brands tasted like the exhaust pipe of a rusty Buick.
4. Misusing Averages
Averages are like knives; they serve a useful purpose, but you shouldn’t throw them at people indiscriminately. The most commonly used type of average is the mean. But a mean is meaningful only in some situations where the values are fairly evenly distributed. If your earnings from a website during a specific week are 5 dollars every day except Sunday, when you earn 5000 dollars, then your average daily earnings are $718.57. But you shouldn’t conclude that you can expect to earn that much on an average day, because with only one highly lucrative day in the mix, the high figure very well could be an outlier that might never crop up again. (As Al Franken once noted, he, his wife and his son had an average gender of male.)
The median is another commonly applied type of average that also can be deceptive.The median number is the middle figure in an odd set of numbers, or the mean of the two middle numbers in an even list. Thus, there is the same number of values on either side of the median sandwich. But it doesn’t reveal anything about spacing. The median gives a false impression when you have a range like 1,2,3,4,5,6,10, 25, 50, 75, 100. Here, the median is 6; but it does a very poor job of representing the series as a whole.
5. Mislabeling the denominator
It’s also all too common for statistics to be cited as a tally of one thing, when in fact they are a representation of something else altogether. A classic example is the “statistic” of 2.5 million defensive gun uses in the U.S. annually, according to the famous (or infamous) “study” (survey) conducted by Dr. Gary Kleck of Florida State University. In fact, neither this number nor any other reliably gauges the number of such incidents. What Dr. Kleck actually tallied was how often gun owners claimed to have engaged in such defenses. And there is every reason to believe these claims don’t even remotely stack up in the real world.
Another blatant manifestation is just about anything put out by Media Research Center, a right-wing “media watchdog” that has expended decades in tirelessly trying to substantiate the canard of “liberal bias” in the mainstream media. And by golly it has several web pages of stats to prove its argument. Except… no, it doesn’t. Almost without exception, its “studies” simply show that most people believe in the librulmedia. Which is hardly surprising given how relentlessly that narrative is hammered into the public psyche by folks like MRC — and by the “liberal media” itself.
6. Faulty Inference
Finally, we all crave some kind of takeaway from a data set. Humans are storytelling animals, and most people don’t relate to numbers unless they’re attached to a narrative, a broad conclusion. Unfortunately, those conclusions often wander off the road into the thicket.
One of the most frequent errors in this regard is conflating correlation and causation — or, assuming that with equals because of. You might, for example, hear statistics to the effect that drownings increase at about the same time as sales of ice cream, and conclude that one must cause the other. In reality, though, such a conjunction is likely due to some other factor such as… I dunno, the weather at that time of year or something.
Referring back to the example above of the voting breakdown on the Civil Rights Act, Republicans often broach the topic to “prove” that it is really Republicans and not Democrats who are champions of civil rights (after all, they come to the rescue of poor marginalized billionaires, don’t they?), and it is really Democrats and not Republicans who are racists. Aside from the figures they present being a drastic oversimplification, the upshot they extract from it totally ignores (or denies) the fact that both parties have undergone extreme realignments in recent decades; so comparing either one to the party of the same name in the past is irrelevant.
In sum, numbers sometimes need ifs, ands and buts to place them in a context that jibes with reality. But even though they must be handled with care, there’s still no substitute for statistics. They’re certainly a hell of a lot more reliable than Brian Kilmeade.
